

Listen to the article
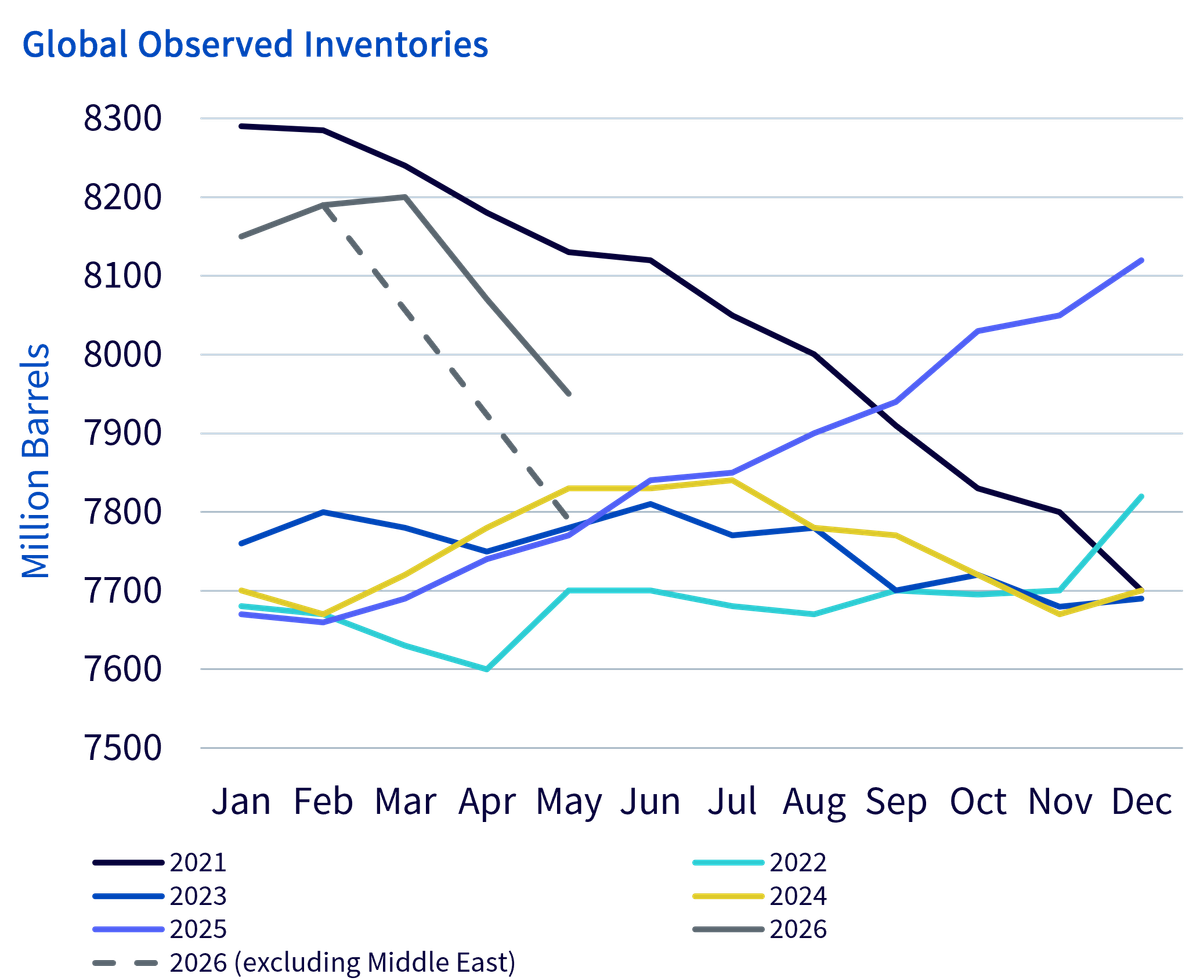
Global oil and oil product inventories have been falling at a record pace since the start of the US/Israel-Iran war. Before the conflict began, inventories were elevated at around 8.2 billion barrels (bn bbls), providing a meaningful cushion to global demand and helping to soften the impact on oil prices.
Since the start of the war, inventories have fallen by 246 million barrels (mb) by end-April 2026. Excluding oil trapped in the Middle East Gulf, the draw is even larger at 378mb over the same period.
Source: WisdomTree, IEA Monthly Oil Market Report May 2026, Kayrros, Kpler, FEDCom/S&P Global Platts, Enterprise Singapore. Historical performance is not an indication of future performance and any investments may go down in value.
Sea-borne inventories were the first to draw down
Most of the early decline came from oil at sea, using data through March. That was the easiest supply to mobilise: barrels already on tankers could be redirected relatively quickly, provided the ships were positioned outside the Strait of Hormuz.
The next-largest draw has come from OECD industry product stocks, including gasoline and distillates. OECD industry crude stocks rose modestly through end-March, but are now beginning to decline as well.
China may now be turning from building to drawing inventories
China crude inventories continued to build through March, but in April they began to draw. That marks an important turning point, and one that could accelerate the global inventory decline further if sustained.
At the same time, a coordinated OECD strategic reserve release of 400mb was announced on 11 March 2026. As of 8 May, 164mb of that draw had been completed, and the pace of withdrawals is now accelerating.
The inventory draw is accelerating, not easing
While oil and oil product inventories were bloated before the crisis, the drawdown is now rapid and accelerating. The longer the Strait of Hormuz remains closed, the larger the draw on inventories is likely to be.
Saudi Arabia and the UAE have successfully ramped up pipeline exports, and Middle East shipments are increasingly being routed away from the Strait where possible. There has also been a surge in oil production from the Atlantic Basin. But without significant new infrastructure, the scope for further offset remains limited.
Headline inventories still look large, but usable stocks are much smaller
More than 7.5 billion barrels of oil in storage still sounds substantial. But headline stocks are not the same as freely available stocks.
Since the start of the war, close to 13 million barrels per day of oil production has been lost, or just under 400mb a month. If demand were to remain steady, most of that shortfall would have to be met by inventory draws. On a naïve basis, current stock levels would imply close to 20 months of supply.
The problem is that inventories cannot be drawn to zero. Storage systems have technical limits, and a minimum level of pressure is needed for the system to function properly. The issue is not just how much oil exists, but how much can actually circulate.
Some analysts estimate that only 0.8 billion barrels can be withdrawn before the system begins to experience operational stress1.
Based on IEA data estimates, we are already around halfway toward that level of withdrawal. With inventory draws accelerating, the stress point could be reached relatively quickly.
Why is Brent oil still below $100/bbl?
That is the key question. Brent oil prices previously spiked to around $120/bbl when the situation looked less severe. More recently, the market has been pricing in hopes of a ceasefire and the start of a lasting peace process. Those expectations are now being challenged by every passing day.
Chevron CEO Mike Wirth warned that “the buffers and the shock absorbers are being steadily drawn down, and the ability for the market to absorb this imbalance is drastically diminished today versus where we started.”2
We believe, based on internal forecasts models and data, that once operational stress begins to emerge, prices could spike materially higher, potentially beyond the levels reached in March 2026. While outcomes remain highly uncertain and dependent on geopolitical developments, prices above $150/bbl cannot be ruled out if momentum builds. That said, such levels may not be sustainable for long, as they would likely accelerate negotiations and trigger meaningful demand destruction.
Investment implications: oil and the broader commodity complex
For investors looking to hedge against the inflationary pressure from even a short-lived spike in oil prices, energy exposure remains relevant, alongside the broader commodity complex.
At the same time, a sharp rise in oil prices could also support inflation expectations just as it weighs on growth. In that sense, commodities may serve as a useful hedge against both an energy shock and the broader macro slowdown that could follow.
|
WisdomTree Bloomberg Brent Crude Oil |
|||
|
WisdomTree Bloomberg WTI Crude Oil |
|||
|
WisdomTree Brent Crude Oil ETC |
|||
|
WisdomTree WTI Crude Oil ETC |
|||
|
WisdomTree Enhanced Commodity UCITS ETF – USD Acc |
|||
|
WisdomTree Enhanced Commodity ex-Agriculture UCITS ETF – USD Acc |
|||
|
WisdomTree Broad Commodities UCITS ETF – USD Acc |
Source: WisdomTree as of June 2026
1 JP Morgan quoted in Financial Time on 5th May 2026: https://www.ft.com/content/8ebecab1-552e-4e12-96cf-c36d738aeb2e
2 Comments made at a Bernstein conference on 28th May 2026: https://chevroncorp.gcs-web.com/static-files/fb7b18b8-03af-4bdb-8306-8ad1b078a335
Den vollständigen Artikel hier lesen

4 Kommentare
Great insights on ETF-News. Thanks for sharing!
I’ve been following this closely. Good to see the latest updates.
This is very helpful information. Appreciate the detailed analysis.
Good point. Watching closely.